Heatwave Impacts
Goal
To identify those unitary authorities most likely to experience more heatwaves over the target time periods.
Heatwave definition
From the Met Office website:
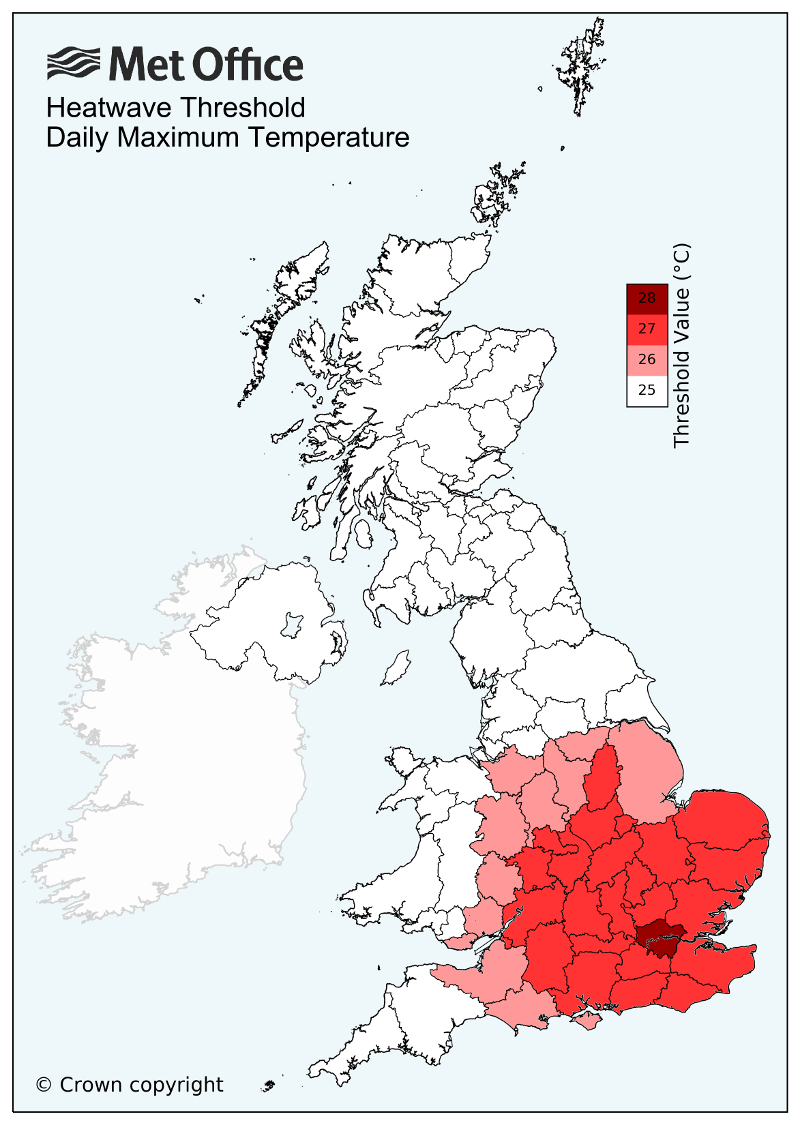
“A UK heatwave threshold is met when a location records a period of at least three consecutive days with daily maximum temperatures meeting or exceeding the heatwave temperature threshold. The threshold varies by UK county, see the UK temperature threshold map below.”
For further info on heatwaves see here.
Outputs
An interactive map based on the heatwave event data. Credit: Natalie Rose
IMPORTANT
There’s currently some noise in the heatwave events data. Some double-counting of days contributing to heatwave events means the numbers are skewed upwards. Adjustment is needed in this R code to return accurate results. The visual still indicates a trend, but the numerical values are out.
Source data
The UKCP18 UK Climate Projections.
Methodology
The following steps were carried out to calculate the likely number of heatwaves per unitary authority per time period:
-
Download the daily tasmax (temperature-at-surface maximum) data for all ensemble model members for all the years required. Use the CEDA Archive, e.g. https://data.ceda.ac.uk/badc/ukcp18/data/land-rcm/uk/12km/rcp85/01/tasmax/day/latest which lists all the daily tasmax data for the 01 ensemble model member in files divided by decade, e.g. rcm_uk_12km_01_day_20501201-20601130.nc
-
Execute this Python script to replace temperature values <=24 with NaN to reduce filesize whilst maintaining time series integrity and convert to CSV.
-
Execute this R code to identify heatwave events in the CSV files where a heatwave event = 3 consecutive days where the max temp >= the regional threshold for that grid cell.
-
TODO